Mastering the Ascending Triangle Pattern: A Trader’s guide
“Subscribe for Stock Picks, Trends & Trading Lessons sent directly to your inbox.”
The Ascending Triangle Pattern is one of my personal favorite classical chart patterns to trade. Some of my best returns have come from spotting and trading this breakout pattern across various stocks and markets. From my experience, it often delivers strong follow-through, making it a reliable tool in any trader’s arsenal.
This pattern starts wide, with drastic highs and lows, gradually narrowing as the price consolidates. Over time, the price action forms a horizontal resistance line at the top, while the bottom support line slopes upward, creating the distinct ascending triangle shape.
Table of Contents
- What is an Ascending Triangle Pattern?
- Why This Pattern Works
- How to Identify an Ascending Triangle Pattern
- Trading the Ascending Triangle Pattern
- Examples of Ascending Triangle Patterns
- Pro Tips for Trading Ascending Triangles
- Why Do Chart Patterns Work?
- Final Thoughts
What is an Ascending Triangle Pattern?
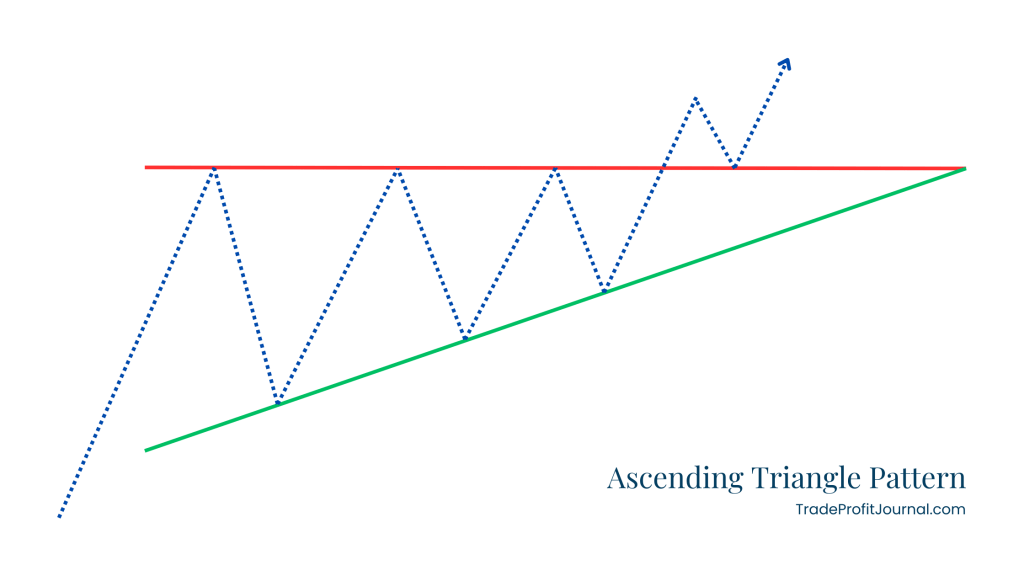
The Ascending Triangle Pattern is characterized by a series of higher lows converging toward a horizontal resistance level. Here’s a quick breakdown:
- Resistance Line: Formed by connecting two or more rejection tops at the upper price level.
- Support Line: Slopes upward by connecting three or more higher lows, showcasing bullish pressure.
This consolidation often leads to explosive breakouts, as the price winds up like a coiled spring, ready to burst upward.
Why This Pattern Works
The beauty of this setup lies in its predictability. As buyers continue to push prices higher (forming higher lows), they apply increasing pressure on the resistance level. Once the resistance gives way, the breakout is often dramatic and lucrative.
However, patience is critical. Waiting for confirmation of the breakout minimizes false starts and liquidity sweeps—a frustrating reality for many traders when stop-loss orders get triggered prematurely.
How to Identify an Ascending Triangle Pattern
Spotting this pattern is simple once you train your eye. Here’s what to look for:
- Horizontal Resistance Line: The top line should connect at least two high points and run horizontally.
- Upward-Sloping Support Line: The bottom line should connect three or more higher lows and move upward from left to right.
- Active Price Movement: Ensure there’s consistent price action between the two trendlines. A strong ascending triangle has visible movement within its boundaries, not a price hugging just one line.
Trading the Ascending Triangle Pattern
Trading ascending triangle patterns is straightforward but requires discipline. Follow these steps to maximize your success:
1. Wait for Confirmation
Never jump in before the breakout is confirmed. Look for the price to break above the horizontal resistance line and close above it. For example, if you’re trading on the daily chart and the breakout happens Wednesday, wait until Thursday’s close confirms the move.
2. Set Your Stop Loss
Place your stop loss just below the breakout point (the old resistance line). This accounts for retests, which are common in the days following a breakout. Avoid setting your stop too tight, as price fluctuations might trigger it prematurely.
3. Define Your Take-Profit Target
Use the triangle’s height to calculate your price target. Measure the distance from the resistance line to the start of the upward-sloping support line. Add this measurement to the breakout point to determine your take-profit level.
Examples of Ascending Triangle Patterns
Apple Inc. (AAPL)
Over the years, Apple has demonstrated textbook ascending triangle patterns with bullish breakouts.
In the chart below:
- The resistance line connects at least two highs, while the support line connects three higher lows.
- Price action fluctuates between these lines before breaking out to the upside.

The second example also highlights how to measure the triangle’s height and apply the measurement as your estimated take-profit level.

Pro Tips for Trading Ascending Triangles
- Beware of False Breakouts
Sometimes, price action might briefly break above resistance only to fall back into the pattern. This is why confirmation is crucial—wait for the price to hold above resistance. - Embrace Retests
Don’t panic if the breakout retraces to retest the resistance line (now acting as support). This is common and often strengthens the pattern’s validity. - Combine with Other Indicators
While ascending triangles are powerful, they shouldn’t be used in isolation. Combine them with volume analysis or trend indicators for a stronger setup.
Why Do Chart Patterns Work?
My theory? Chart patterns like the ascending triangle work because enough traders believe they do. When traders collectively spot a pattern and anticipate a breakout, their actions (buying or selling) create a self-fulfilling prophecy. It’s a network effect that fuels market momentum.
Final Thoughts
The ascending triangle pattern is a fantastic tool for identifying potential breakouts. However, don’t force patterns to fit—they must meet the criteria discussed here to be reliable. Over time, as you sharpen your technical analysis skills, you’ll spot these patterns effortlessly.
Joining a trading community can also be invaluable. Sharing your chart ideas and receiving feedback helps validate patterns and improve your trading accuracy.
If you’re looking for more trading tips, lessons, and stock insights, subscribe to my newsletter below and get exclusive content delivered straight to your inbox!
“Subscribe for Stock Picks, Trends & Trading Lessons sent directly to your inbox.”

Leave a comment