What to Watch as We Lead Into a Narrowing Performing Market Towards the End of the Year.
“Subscribe for Daily Stock Picks, Trends & Market Overviews sent directly to your inbox.”
Table of Contents
- Market Overview: SPY, QQQ, and DOW Ahead of the Fed Decision
- Joby Aviation (JOBY): Bullish Pennant Breakout
- Walmart (WMT): Bull Flag Pattern and Overbought Risks
- QuantumScape (QS): Breakout and Key Resistance Levels
- Boeing (BA): Inverted Head & Shoulders and Resistance Outlook
- Conclusion
Market Overview: SPY, QQQ, and DOW Ahead of the Fed Decision
The broader market is treading cautiously ahead of the highly anticipated Federal Reserve meeting this afternoon. With November’s inflation data coming in slightly above expectations, there’s growing skepticism about whether the Fed will cut rates by a quarter point.
- SPY (S&P 500 ETF): Trading at $605.66, SPY remains near all-time highs with strong support at the 20-day moving average (602.46). Bulls are watching resistance near $609 to confirm continuation of this uptrend.
- QQQ (Nasdaq 100 ETF): Closing at $535.71, QQQ maintains its upward trajectory after breaking a wedge pattern. The RSI at 68 signals caution, as overbought conditions may trigger near-term volatility.
- DOW (Dow Inc.): DOW shows relative weakness, closing at $41.09, with resistance at the 50-day (46.28) and 100-day (48.98) moving averages. It reflects broader caution in industrial stocks despite a recent bounce.
Markets remain optimistic for a dovish Fed tone. However, any hawkish surprise may lead to swift corrections, particularly in overextended sectors like tech.
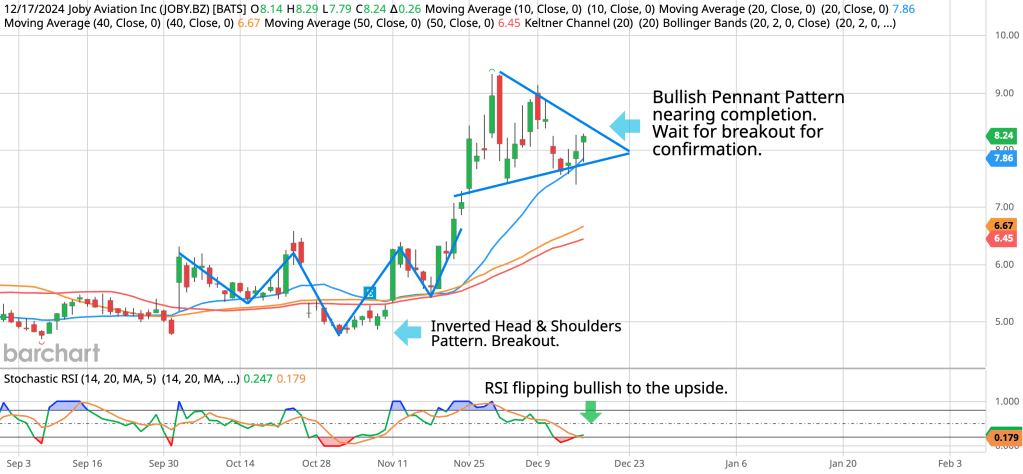
Joby Aviation (JOBY): Bullish Pennant Breakout

Joby Aviation (JOBY) has successfully completed a textbook Bullish Pennant breakout on the daily chart. After consolidating within the pennant, JOBY surged to $8.70, paired with a strong RSI level of 63. This breakout follows the earlier Inverted Head & Shoulders pattern, signaling bullish continuation.
Key Levels:
- Next resistance: $9.33 (swing high)
- Support: $8.50 (prior resistance turned support)
The stock’s increasing volume and technical strength make it a candidate for further upside, but traders should monitor for pullbacks near the 20-day moving average (7.97).
Below is a chart from yesterday’s blog post, read it here.
Walmart (WMT): Bull Flag Pattern and Overbought Risks
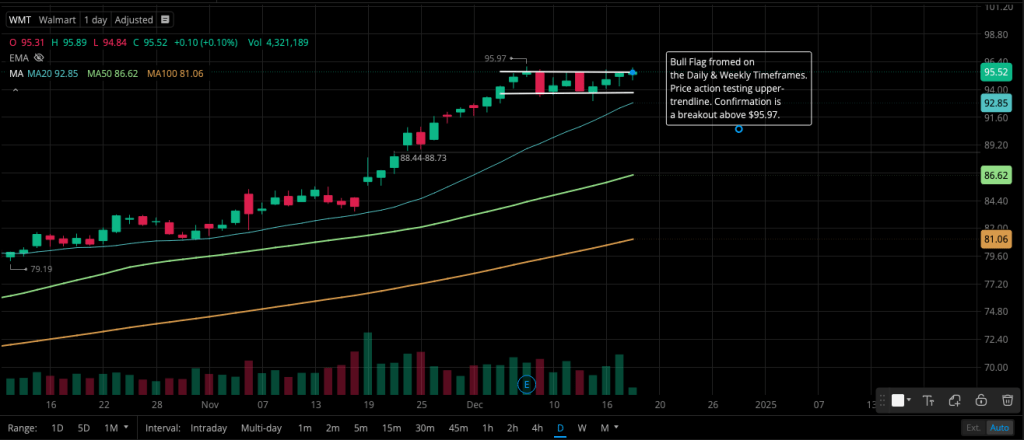
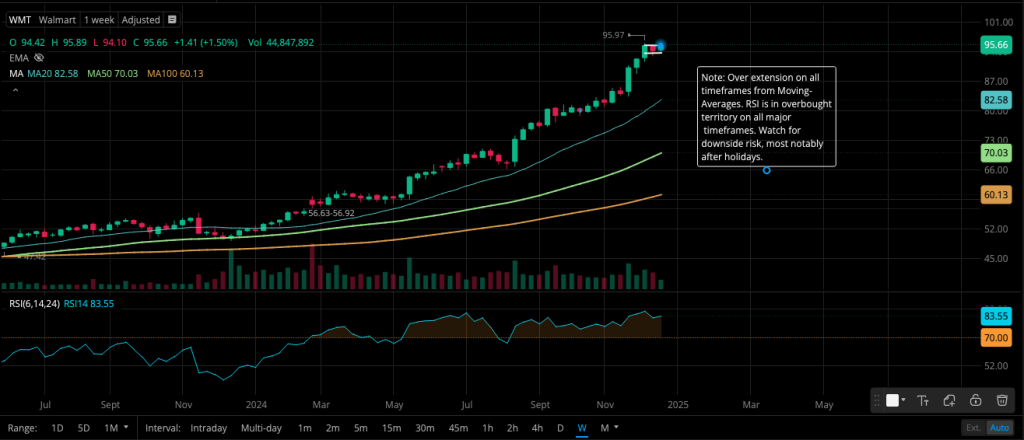
Walmart (WMT) is exhibiting a classic Bull Flag pattern on the daily and weekly timeframes. Price action is consolidating below the upper trendline at $95.97, with a breakout confirmation needed to signal further upside.
However, WMT appears overextended across timeframes:
- RSI at 83.55 indicates overbought conditions, increasing the risk of pullbacks.
- Support levels to watch: $92.85 (20-day MA) and $86.62 (50-day MA).
Traders should remain cautious post-holiday as profit-taking could cool off WMT’s momentum.
QuantumScape (QS): Breakout and Key Resistance Levels
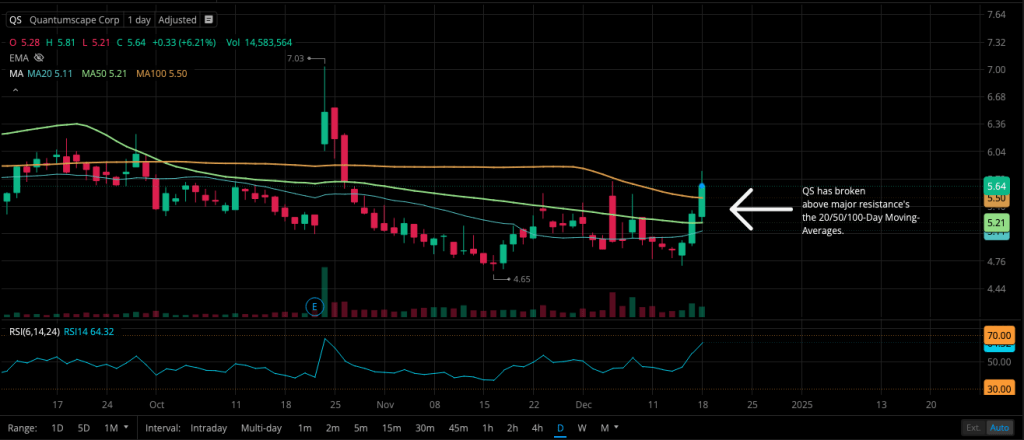

QuantumScape (QS) has broken above significant 20, 50, and 100-day moving averages, closing at $5.64. This move signals renewed bullish momentum with rising volume to confirm.
Key Levels:
- Immediate resistance: $5.78 (Fibonacci level)
- Breakout target: $6.49
- Support: $5.21 (50-day MA)
Given QS’s history of rapid moves in both directions, traders should proceed with caution and watch for rejection near resistance levels.
Boeing (BA): Inverted Head & Shoulders and Resistance Outlook
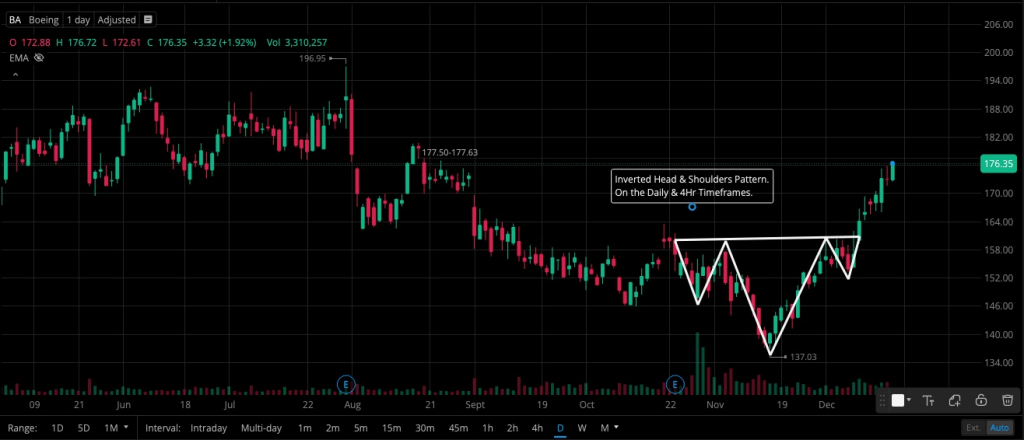
Boeing (BA) has formed a bullish Inverted Head & Shoulders pattern on the daily and 4-hour timeframes, signaling a reversal. The stock broke out above its neckline at $164, pushing to $176.83.
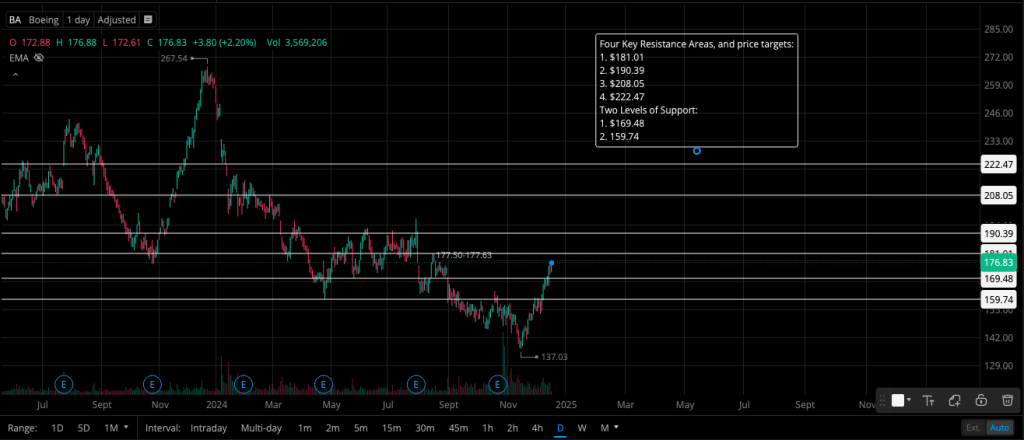
Resistance Levels:
- $181.01
- $190.39
- $208.05
- $222.47
Support: $169.48 and $159.74. Traders can watch for pullbacks to these levels for potential re-entry.
Conclusion: Navigating Market Uncertainty and Breakout Opportunities
The broader market is walking a tightrope ahead of the Fed’s rate decision, with SPY and QQQ showing strength while DOW reflects caution. Stocks like JOBY, QS, and WMT are offering compelling technical setups, but overbought conditions and key resistances warrant careful trade management.
Stay nimble, monitor volume, and watch the Fed’s tone closely to determine market direction in the days ahead. With volatility likely, these breakouts could turn into significant opportunities or swift reversals.
“Subscribe for Daily Stock Picks, Trends & Market Overviews sent directly to your inbox.”

Leave a comment