Breaking down (the Breakouts) PTON, JOBY, GILD, and ANF Technical Analysis.
Table of Contents
- Broader Market Outlook: SPY, QQQ, and DOW in Focus
- Abercrombie & Fitch (ANF) – Symmetrical Triangle Setup
- Gilead Sciences (GILD) – Symmetrical Triangle Breakout with Bullish Catalysts
- Peloton (PTON) – Bullish Momentum with Key Price Targets
- Joby Aviation (JOBY) – Bullish Pennant with FAA Tail Test Clearance
- Conclusion
Broader Market Outlook: SPY, QQQ, and Dow in Focus
As we head toward the end of the year, the broader market continues to showcase a mixed but cautious tone across the S&P 500 (SPY), Nasdaq 100 (QQQ), and Dow Jones Industrial Average (DOW). While the SPY and QQQ maintain their upward trajectories, the Dow remains the clear laggard, weighed down by ongoing selling pressure. Let’s break down each index to understand the broader market landscape.
The S&P 500 (SPY) remains in an uptrend, comfortably trading above its 20-day moving average at $601 and currently holding near $605. Despite minor pullbacks, the SPY has shown resilience, reflecting underlying strength in large-cap equities. Traders should watch for a potential retest of recent highs as we close out the year.
The Nasdaq 100 (QQQ) continues to lead with strong bullish momentum, currently trading above its key moving averages. Tech-heavy names have been driving this rally, with QQQ holding above the 527 level. If momentum persists, we could see QQQ attempt to challenge higher levels heading into early 2025.
In contrast, the Dow Jones Industrial Average (DOW) is under pressure, with price action trending below all major moving averages. The DOW recently found some short-term support near $40.76, but it remains in a clear downtrend. For bulls, a reversal above the 20-day moving average near $41.65 would be a first step to signal a potential shift in momentum.
Overall, while tech and large-cap stocks remain strong drivers of market performance, the divergence with the Dow highlights pockets of weakness. Heading into the new year, traders should keep a close eye on these divergences and monitor whether the broader market can maintain its upward momentum or if cracks begin to appear.
Abercrombie & Fitch (ANF) – Symmetrical Triangle Setup
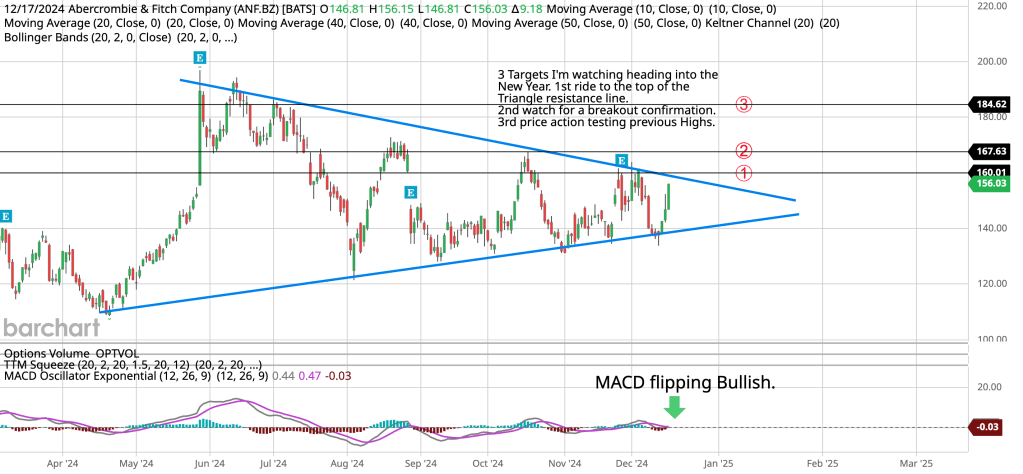
In this chart, Abercrombie & Fitch (ANF) is forming a symmetrical triangle pattern, signaling a potential breakout as we head into the New Year. The price action is currently consolidating between the triangle resistance and support lines, creating three key targets to watch. The first target lies at $160.01, where price is testing the triangle resistance line. A breakout above this level would confirm bullish momentum and set up the next target at $167.63, a previous resistance zone. If momentum remains strong, we could see price action test the highs at $184.62, marking the third target.
The MACD oscillator is flipping bullish, as highlighted on the chart, with the signal line crossing above the MACD line. This shift in momentum indicates increasing buying pressure, aligning with the expectation of an upward breakout. Additionally, the Bollinger Bands are beginning to tighten, which often precedes a strong move in either direction.
Heading into 2025, traders should watch for confirmation of a breakout above the triangle resistance. A decisive move with strong volume could pave the way for price to test previous highs. If the breakout fails, price could retreat toward the support line. Keep an eye on these targets and momentum indicators for further confirmation of the trend!
Gilead Sciences (GILD) – Symmetrical Triangle Breakout with Bullish Catalysts
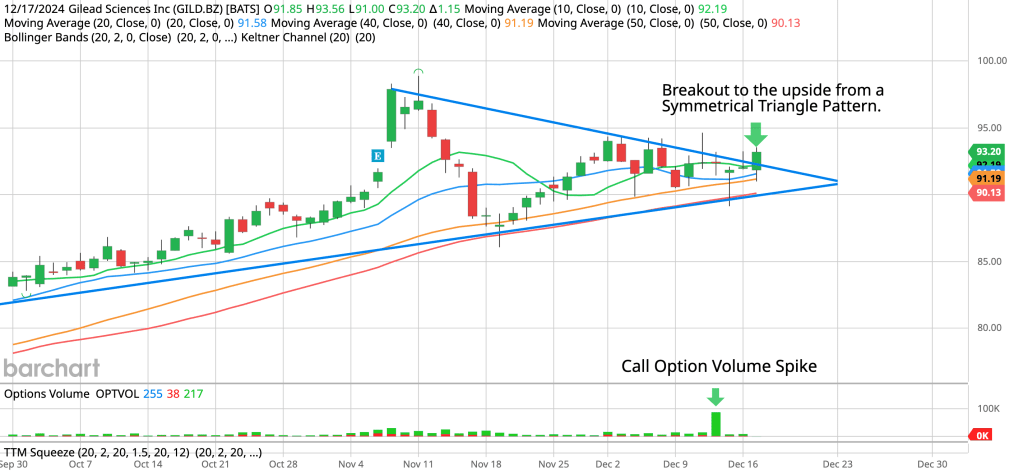
Gilead Sciences (GILD) has officially broken out of a symmetrical triangle pattern, signaling potential bullish momentum as we head into the year-end. The breakout occurred alongside a notable spike in call option volume, indicating that buyers are positioning themselves for further upside. Price action has cleared the triangle resistance, currently trading near $93.20, supported by the 10-day and 20-day moving averages.
The breakout is complemented by a fundamental catalyst: FDA approval for Trodelvy as a treatment for small cell lung cancer. This approval is a game-changer for Gilead, not only solidifying their oncology portfolio but also opening up significant revenue potential. The combination of a technical breakout and a strong fundamental tailwind positions GILD for a continued move higher.
Traders should watch for price to hold above the breakout point and look for follow-through in the coming sessions. If momentum continues, GILD could target its previous highs near the $95-$100 range. Keep an eye on options volume and any post-FDA news that could fuel additional bullish sentiment.
Peloton (PTON) – Bullish Momentum with Key Price Targets
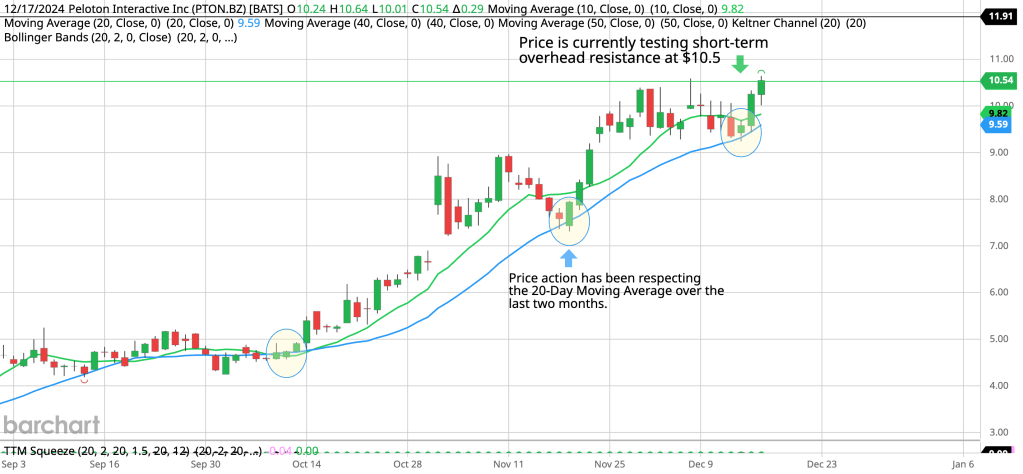
Peloton (PTON) is showing strong bullish momentum, driven by price action that continues to respect the 20-Day Moving Average. Over the last two months, the stock has maintained a steady uptrend, with dips consistently finding support near this level. Price is now testing short-term overhead resistance at $10.5. A clean breakout above this zone would confirm the continuation of the uptrend, opening the door for the next levels of resistance.
This momentum is supported by Peloton’s strategic focus on cost-cutting initiatives and raising their subscription costs to boost revenues. Additionally, the company has delivered two consecutive earnings beats, signaling improving financial performance and investor confidence. The technicals align with the fundamentals here, creating a compelling setup for further upside.
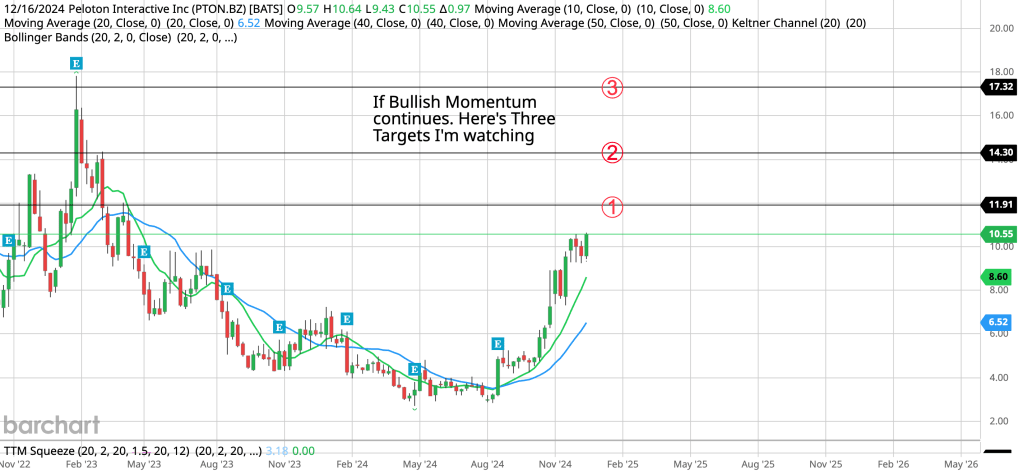
If bullish momentum continues, the next three targets to watch are:
- $11.91 – A key resistance level that aligns with prior highs.
- $14.30 – A mid-term resistance area.
- $17.32 – The upper resistance zone, where price previously stalled.
To sustain this move, price action must break above $10.5 and hold this level as new support. Traders should monitor volume closely for confirmation, as increasing volume on a breakout would validate continued buyer strength. With momentum on its side and improving fundamentals, PTON could be on track to hit these levels in the coming months.
Joby Aviation (JOBY) – Bullish Pennant with FAA Tail Test Clearance

Joby Aviation (JOBY), one of the leading names in the eVTOL (electric vertical take-off and landing) space, has received a strong boost following its FAA clearance for Tail Test operations. This pivotal news has propelled the stock into a bullish pennant pattern, a setup that signals potential continuation of the recent upward trend.
Technically, JOBY’s price action has formed a textbook bullish pennant, with consolidation narrowing toward the apex. A breakout above the resistance line near $8.3 could ignite significant upside momentum, targeting price levels of $9.4 and $11.5. Supporting this bullish setup is the earlier Inverted Head and Shoulders breakout from November, which marked the beginning of JOBY’s strong uptrend.
The RSI is also flipping bullish, indicating that buying momentum is starting to pick up again. With the stock currently above all major moving averages (10, 20, and 50), JOBY appears well-positioned for a breakout confirmation. Traders should watch for volume to increase alongside the breakout, as this would validate strength behind the move.
Fundamentally, Joby’s FAA clearance adds further confidence in its role as a leader in the growing eVTOL market. If momentum aligns with the technical setup, JOBY could be on track to hit its next targets in the coming weeks.
Conclusion
As we wrap up, the broader market continues to show signs of strength, with SPY and QQQ maintaining their bullish momentum while the Dow lags behind. This divergence highlights the importance of focusing on individual opportunities where technical setups and fundamentals align.
The four stocks highlighted – ANF, GILD, PTON, and JOBY – each present unique breakout opportunities driven by clear technical patterns and strong catalysts. From ANF’s symmetrical triangle to GILD’s FDA approval breakout, PTON’s bullish momentum, and JOBY’s bullish pennant supported by FAA clearance, these stocks are ones to watch closely in the coming sessions.

Leave a reply to Key Breakout & Performances Across JOBY, BA, QS, & WMT Ahead of the FED Decision – Trade Profit Journal Cancel reply